Ever since I built my first shiny app back in 2015, I’ve very much appreciated the power of introducing interactivity to research data. Whether it’s data navigator of a large dataset, built to replace reams and reams of a markdown report on data properties or an app to accompany a publication allowing a deeper diving into results, interactive apps are great way of bringing research data to life.
Below is showcase of shiny apps I’ve built or refactored for publication.
Mark-my-Bird-O-space
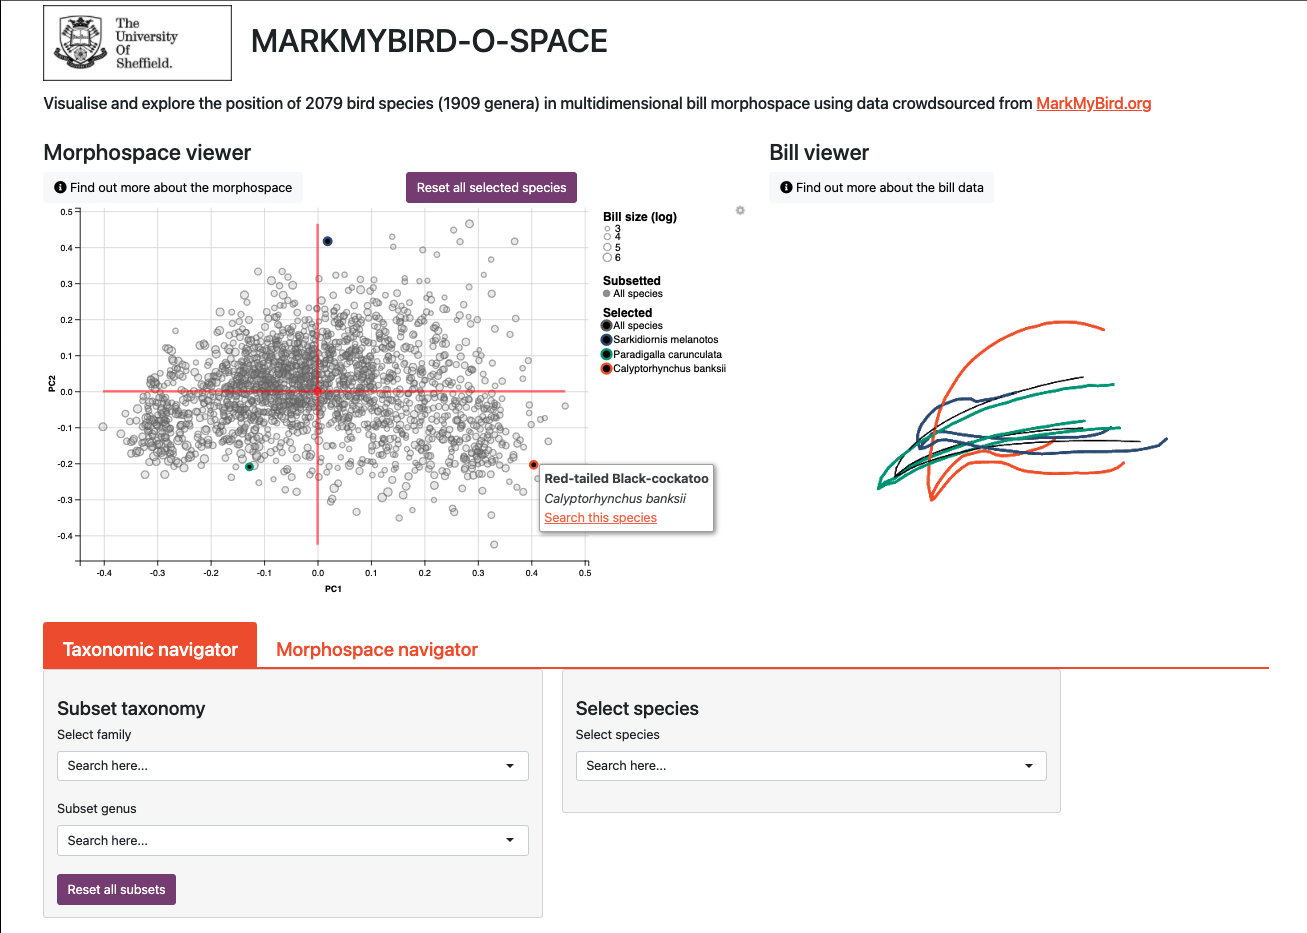
Screenshot of Mark-my-Bird-O-space app displaying bill data for three selected species
An application built for the data generated by the Mark My Bird citizen science project. Citizen scientists ladmarked 3D scans of the bills of all the world’s bird species allowing analysis and comparison of bill morphology across the full avian bill morphospace.
The mark-my-bird-o-space application allows users to explore and compared the standardised shapes of bird bills across morphospace. It was originally built by Chris Cooney, at the time a postdoc of the Mark My Bird team but I was later hired to refactor and prepare the app for publication.
sedMaps
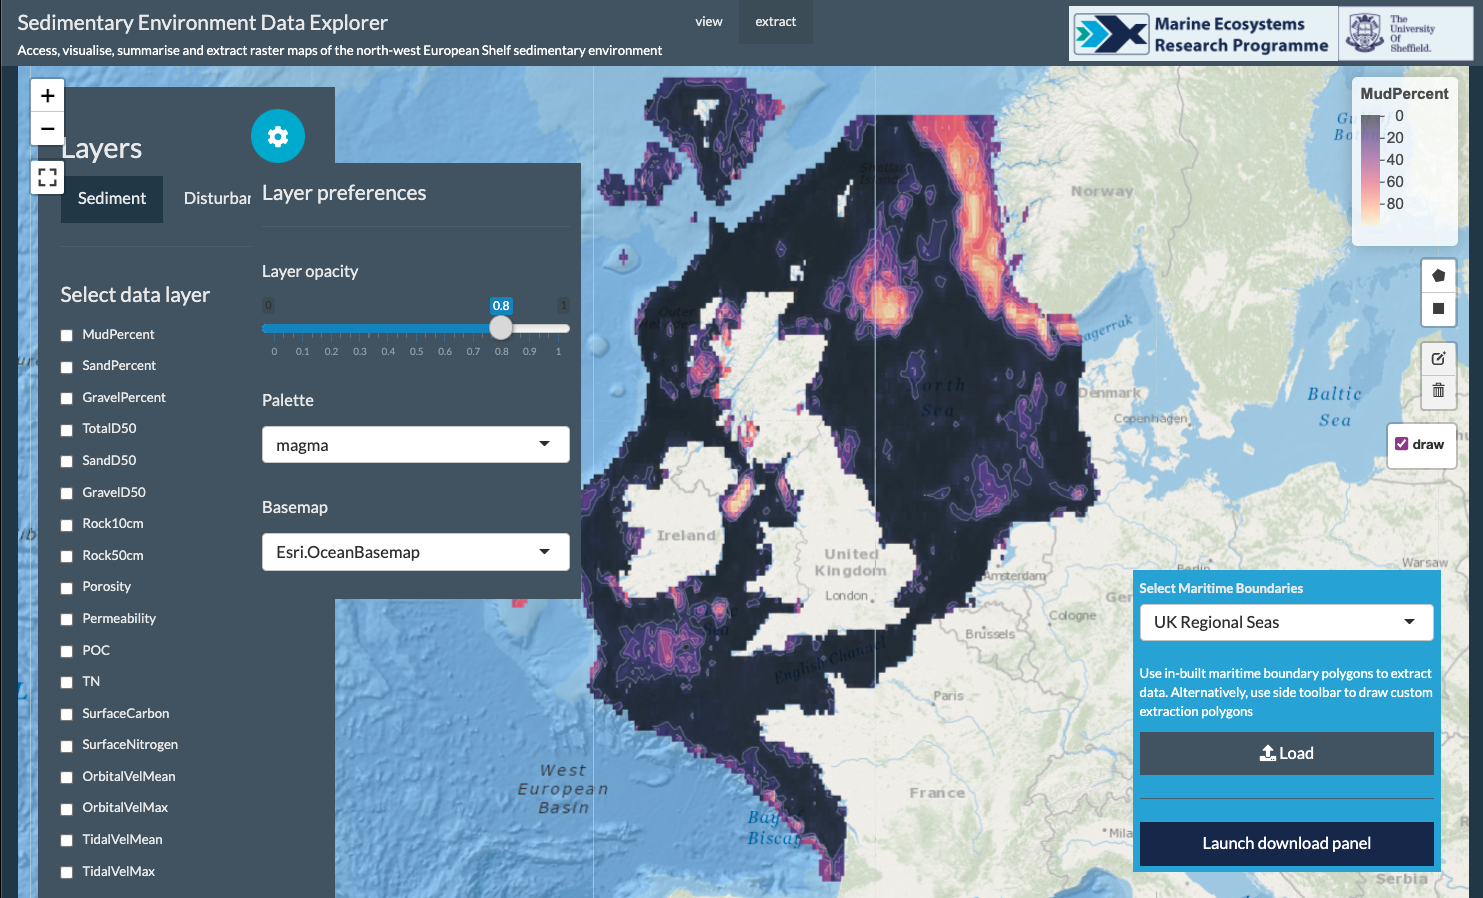
Screenshot of sedMaps app displaying the percentage mud layer, the layer preferences modal and the extract toolbar
The goal of the sedMaps shiny app is to provide access, selection, summarising and visualisation of raster maps of the north-west European Shelf sedimentary environment described in:
Wilson, R. J., Speirs, D. C., Sabatino, A., and Heath, M. R.: A synthetic map of the north-west European Shelf sedimentary environment for applications in marine science, Earth Syst. Sci. Data, 10, 109-130, https://doi.org/10.5194/essd-10-109-2018, 2018
To aid data extraction, the app offers ability to select data through:
- A range of relevant preloaded administrative and ecological vector data,
- Interactively through vector selection tools
- Loading of user vector data.
Enhanced sensitivity to group differences with decision modelling
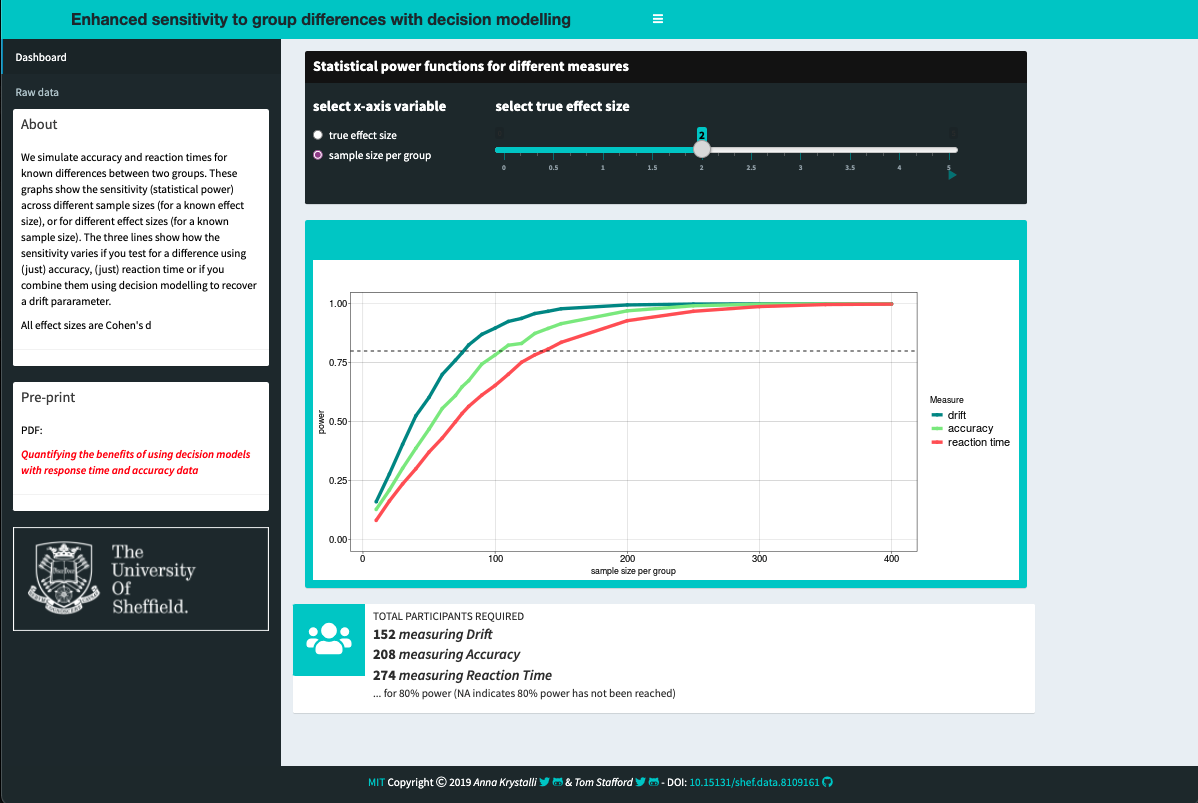
Screenshot of Enhanced sensitivity to group differences with decision modelling app
This app was developed to accompany publication of the results of a simulation of accuracy and reaction times for known differences between two groups. The app allows readers to take a deeper dive into the results and explore in more detail the parameter space explored in the simulation. In particular, the plots can be toggled to show the sensitivity (statistical power) across either different sample sizes (for a known effect size), or for different effect sizes (for a known sample size).
Sex Roles in Birds Data Explorer
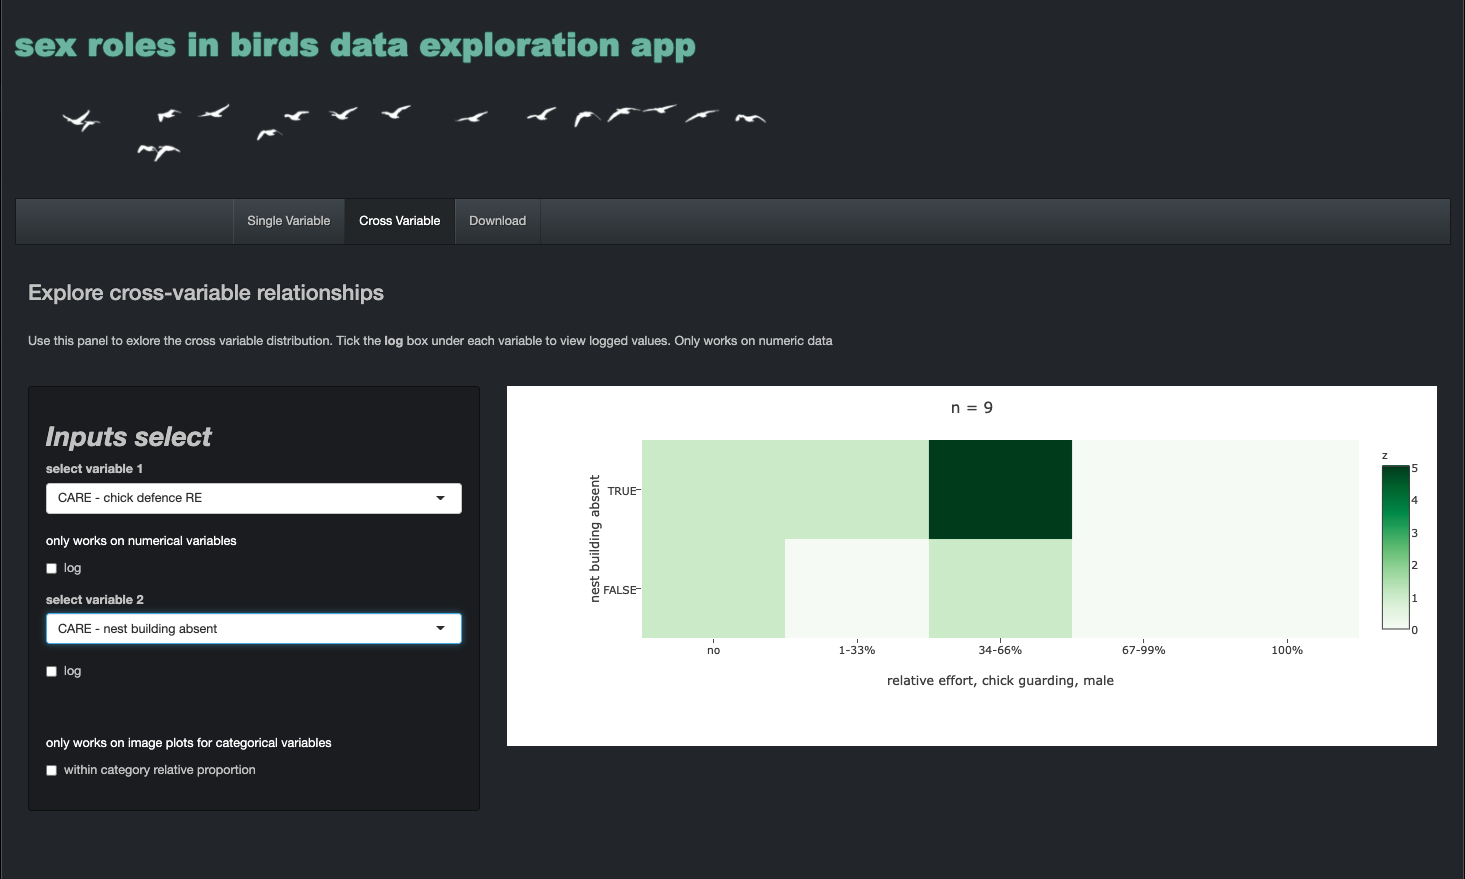
Screenshot of Sex Roles in Birds Data Explorer app
This app is a demo of a private application, developed to navigate a large compiled dataset of over 200 avian biological traits. It’s designed to enable quick access to visual representations and summaries of data, supporting exploratory data analysis and quality control, eg through easy identification of outliers, expected ranges, distributions of data etc. The cross-variable tab enables visualisation of relationships between traits while the download tab allows subsetting and extraction of data. Interactivity was integrated into the visualisations to allow users full control of aspects of interest while determination of correct plot types and application of widget features (eg logging or bin selection) is automated according to trait metadata.
You can also view slides from a short presentation of the app I gave to the Molecular Ecology groups meeting at the University of Sheffield in Dec 2015 on the benefits of navigating large datasets through shiny apps.
fileEncoding checker
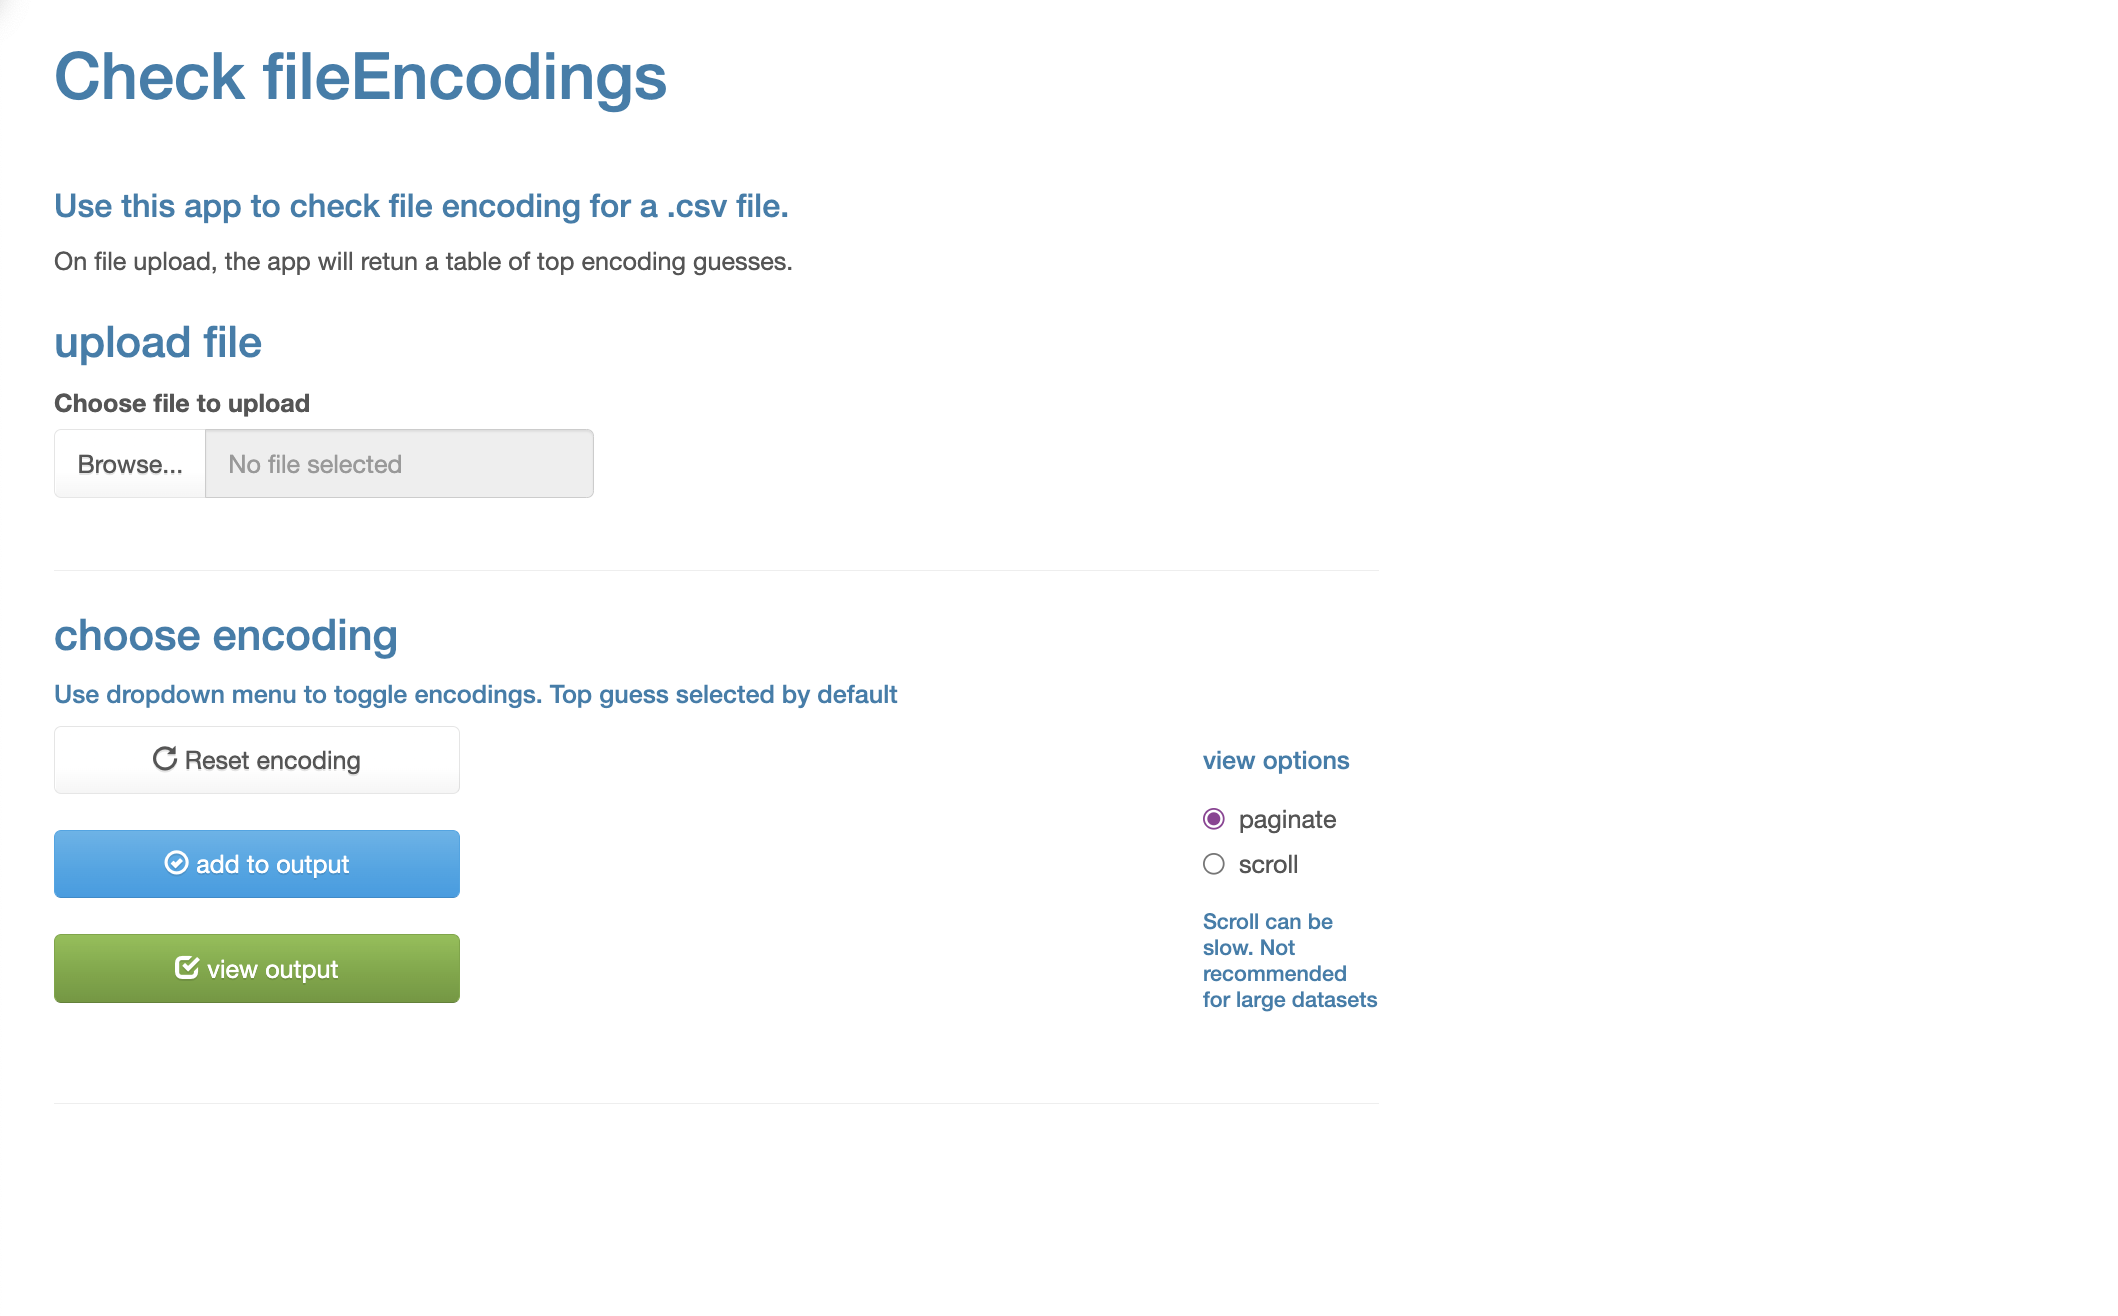
Screenshot of fileEncoding checker app
Shiny app to check csv character encoding and the first shiny app I ever built! App allows user to upload a csv, makes an initial guess at the file encoding on csv load and allows user to toggle through fileEncodings available though R to check the encoding.